
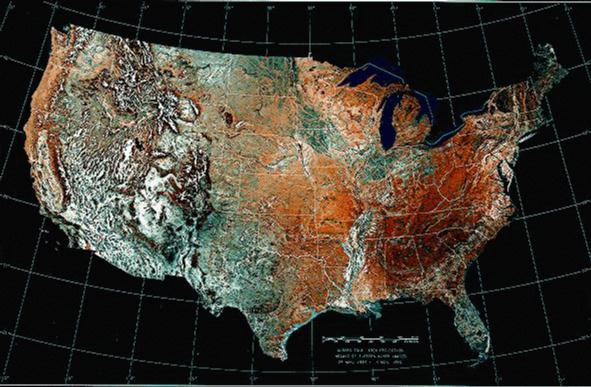
Sight It!™ supports 1 degree Digital Eleveation data distributed on the Internet free by the U.S. Geological Survey (USGS), it is called Digital Elevation Model (DEM) data. The image below, as all the images on this page is of Northern New Jersey from the USGS 1 degree DEM file NEWARK-E.
USGS provides DEMs in 1 degree, 30 minute, 15 minute and 7.5 minute coverage areas, most amateurs involved in VHF operations are familiar with 7.5 minute topographical maps for determining their exact QTH coordinates and elevations or that of a repeater site and for HAAT calculations. It is planned that Sight It! will provide support for all the USGS DEM formats, although the 1 degree is the most widely supported and freely available via Internet.
Sight It!™ is being designed to support the most needed GIS type features into a package geared mainly for the needs of the Radio Amateur. With the support of databases which georeference layers of information such as Political Boundries, County Names, City Names, Major and Minor Roads, user created databases by coordinates and Callsigns, Marathon Checks Points or whatever and other types of data, which can be user selectably overlayed onto the imaged elevation data, Sight It!™ provides the best mapping capability for Amateur Radio.
With the capability to concantenate multiple DEMs and to compress the standard USGS DEMs, we will be able to cover much larger areas than a 1 degree DEM and store the data in a more compact format. By providing support down to a 7.5 minute DEM (1 degree DEM can be zoomed into x600 for effective 7.5 minute coverage, except more data points are in the 7.5 minute DEM for more accuracy) we can provide more accuracy in elevation for a given area when needed.
By creating an application that provides the most needed GIS features for Terrain Analysis and also integerating Amateur Radio specific capabilities such as support for Maiden Head Grid Squares, calcuation of Height Above Average Terrain (HAAT), Distance to the Radio Horizon (DTRH), support of local GPS units, support for Packet radio GPS and Peet Bros. Ultimeter weather stations, support for tactical databases for Emergency communications, Public Service events etc., we have created a truly valuble tool for the hobby that anyone involved in Public Service, Emergency, VHF, UHF, Satellite, Microwave, or Laser communications will find indispensible. In addition, we can easily export elevation data for use by terrain elevations profiles required by YTAD (YT) from N6BV.
With respect to Packet Radio communications, Sight It! will support both standard packet terminal communications for one to one or PBBS operations and it will also support the use of Automatic Packet Reporting System (APRS) Protocals as developed and copyrighted by Bob Bruninga, WB4APR.
Sight It! is a true 32 bit MS-Windows 95 application, written using MS-VC v5.0 C/C++ compiler. It requires as a minimum 16 MB RAM and 40MB of hard disk space to process USGS 1 degree DEMs, a Pentium class PC is recommended. However, for USGS 7.5 minute DEMs or NIMA/DMA DTED Level 0 formats the hardware requirements are much less. Sight It! provides the capability to combine DEMs in to much larger Regions of Interest (ROI) than a single DEM provides, and will also allow you to combine two or more DEMs, then extract a portion and save as a new DEM, this is great when your location (ROI) is spread accross one or more standard DEM coverage areas. Sight It! easy provides for created very large area ROIs, especially using NIMA/DTED Level 0 data, when using APRS for positioning, the entire east coast for instance can easily be created and displayed, and should you also have a hf APRS node active on a second or third port, just add the required DEMs for the areas of the world of interest and you now have a global ROI displayed.
MAIN FEATURES OF THE SOFTWARE
Sight It! provides the Radio Amateur the capability to easily:
Display USGS DEM(s), NIMA/DMA DTED and possbily other elevation and map data formats for a chosen ROI in three modes, Topographic, Color or Shaded and in combinations of the three.
Allow the user to configure the color bins for range and custom color, with all color bins created optionally saved as a recallable color bin separate from or tied to the DEM it was created with for later automatic or manually selected reuse.
Use the mouse pointer (crosshairs) to position any coordinate on screen with real time display of the user selection of coordinate system.
Display coordinates in Latitude/Longitude (Lat/Lon), Universal Transverse Mercatur (UTM), World Geographic Reference System (GeoRef), Maiden Head Grid Squares .
Display Geomagnetic Delcination (Grid Declination) coordinates.
Determine the Elevation at a given coordinate in either meters or feet.
Perform Optical Line of Sight (LOS) calculations between any two geographical points within a DEM.
Perform Radio Line of Sight (R.LOS) calculations between any two geographical points within a DEM.
Perform Path Loss calculations between any two points within the loaded DEM.
Determine Bearing, Distance and Elevation with or without Height Above Ground Level (HAGL) of an antenna system taking into account between any two points within the loaded DEM.
Display bearing in either Degrees or Mils.
Display distances in both Kilometers and Miles between any two points within a DEM.
Perform Height Above Average Terrain (HAAT) calculation for any point within the loaded DEM, displaying the 40 point 8 compass point pattern as an overlay to the DEM and the HAAT derived value. Optionally print an HAAT report for inclusion with repeater documentation.
Determine the Distance to the Radio Horizon (DTRH) taking into account the user entered antenna height at that location while calculating HAAT.
Determine the Distance to the Common Radio Horizon between to points, taking into consideration the user entered antenna height at both locations.
Display a 360 degree fan of LOS or R.LOS, with a user selected radius distance, with or without HAGL taking into consideration for any point within a DEM.
Use a Global Positioning Receiver (GPS) having a NMEA-183 port or standard RS-232C output attached to the host PC’s RS-232C port for user selection as a point reference.
Interface to GPS enabled Packet TNC to for GPS information to display on the DEM georeferenced for all stations heard, with callsign displayed on the DEM for all that fall within the coverage area of the DEM in use, a separate drop down list of all stations heard is also provided.
Interface to the Radio Amateur Callbook, Inc. CD-ROM Callbook to lookup amateurs by callsign for georefering within the DEM in use to the relative postal zone coordinates provided in the database.
Display various overlay layers of georeference data, such as County Names and City Names within the DEM referenced to a user editable database that will allow the use to not only turn individual Cities that we provide On or Off, but will also allow the user to enter additional geographic locations with a Name and set of Coordinates.
Display political boundaries such as County and State outlines referenced to the actual coordinates of the borders of said boundaries.
Support user draw annotation with Letters, Numbers, Lines, Circles, Rectangles and Polygons in user selectable sizes, widths and colors.
Support for user added, user selected and user dragged and dropped Icons of Vehicles, Buildings, Antennas, what ever.
Full support of Automatic Packet/Position Reporting System (APRS).
Print to any MS-Windows compatible Graphics Printer.
Copy to the clip board the currently displayed DEM.
Save imaged data to disks files formats which include: JPG, CMP, TIFF, MPT, BMP, PCX, PNG, TGA, EPS, RAS, WPG, PCT and possibly others.
2/11/98: This is the first new image we have posted in a while. The program has really evolved since we first started posting image captures. We have held off until now because the user interface was fluid for quite a while.
The image below shows our new Maiden Head Grid Square overlay turned on, Political and County lines as well as Cities GeoData turned on. Zoomed in on a the 1 degree DEM for NNJ, we have performed an HAAT calculation in the center of the image, with a 360 degree coverage area sweep overlayed at the same time. We also have the LOS side view display turned on. This much data starts to clutter the display a bit, but is shows you the power of the application.
The next image below shows the start of an analysis for the placement of a new repeater site. The Region of Interest (ROI) has been selected for viewing, the Main Head Grid overlay is on, Elevation bins have been selected to highlight the highest elevations in the area. Then an exact location has been picked for a whatif analysis to determine Height of Average Terrain (HAAT) and Distance to Radio Horizon (DTRH), from here we would next display an HAAT overlay and 360 degree ROS sweep.
We have also now a 3D perspective view capability which may eventually develop into a Flyby animation capability for the production of standard MPEG-1 coded animation files. We have really only begun to develop many of the planned terrain analysis features for Sight It!, when fully integrated with GPS, Weather and Packet radio communications options, Sight It! will provide the most complete GIS package for the Radio Amateur.
Image saved from Sight It!™ LOS Calculator software by N2CKH.
Image saved from Sight It!™ LOS Calculator software by N2CKH.
In the image below, what we are looking at is a Gray Scale image of Northern New Jersey, the darker the color the lower the elevation and the brighter the color the higher the elevation.
Image saved from Sight It!™ LOS Calculator software by N2CKH.
The next image displays elevation ranges in color bins for each elevation range that the user programs. The elevation bin color/range box in the lower left, shows that Black starts at 1 meters and Dark Blue starts at 21 meters in elevation. The range of elevation set for a given color bin is spatially distributed accross the actual elevation points within the range, thus is shown as shades of the color selected for the elevation bin being displayed, with the darkest shade the lowest elevation and the lightest shade the highest elevation.
Image saved from Sight It!(tm) LOS Calculator software by N2CKH.
The next image is also a Gray Scale, of the same area as before, but now Sun Shading has been enabled to provide relief to the image. It can now be clearly seen by the eye at what points the terrain begins to go up hill, or just how rough an area is to transverse.
Image saved from Sight It!(tm) LOS Calculator software by N2CKH.
In the next image is again the same area, but now we have color bins and shading turned on which really provides the impact of both the contour of the land and the actual elevations that are predominate in a given area by color coding.
Image saved from Sight It!(tm) LOS Calculator software by N2CKH.
In this image we have zoomed into a smaller area of Centeral New Jersey on the shore line, with color bins and sun shading turned on, as well as two overlay layers of information, City Names and a user created tactical database, which currently shows four Amateur stations, from the most North to the most South we have K2DE, KE2SO, KB2OPQ and N2CKH. We also have used the annotation/drawing features of Sight It! to create Green colored circles around these stations with interconnecting lines. These capabilities are part of the Tactical Terrain Situational Awareness aspect of Sight It!, which provides for fluid near-real time heads up display of activity as maintained by a key operator of stations in the field georeferenced using Sight It!, for which additional tactical information can be received from the field and annotated onto the Sight It! displayed Region of Interest (ROI) and also taken and disseminated into the field. For instance, the movement of a search party in an emergency situation or drill can be maintain uinsg Sight It! at the EOC and the key operator at the EOC can inform the field party that in the direction of their travel they are about to come to a revine or some other type of rough terrain.
Image saved from Sight It!(tm) LOS Calculator software by N2CKH.